Infographics for presentations

Data visualisation for presentations

Here at Intrepid we understand how to make data look great and convey your message. But what are infographics? Infographics are a visual representation of information or data as charts or diagrams. They’re a blend of information and graphics to help visualise facts and figures.

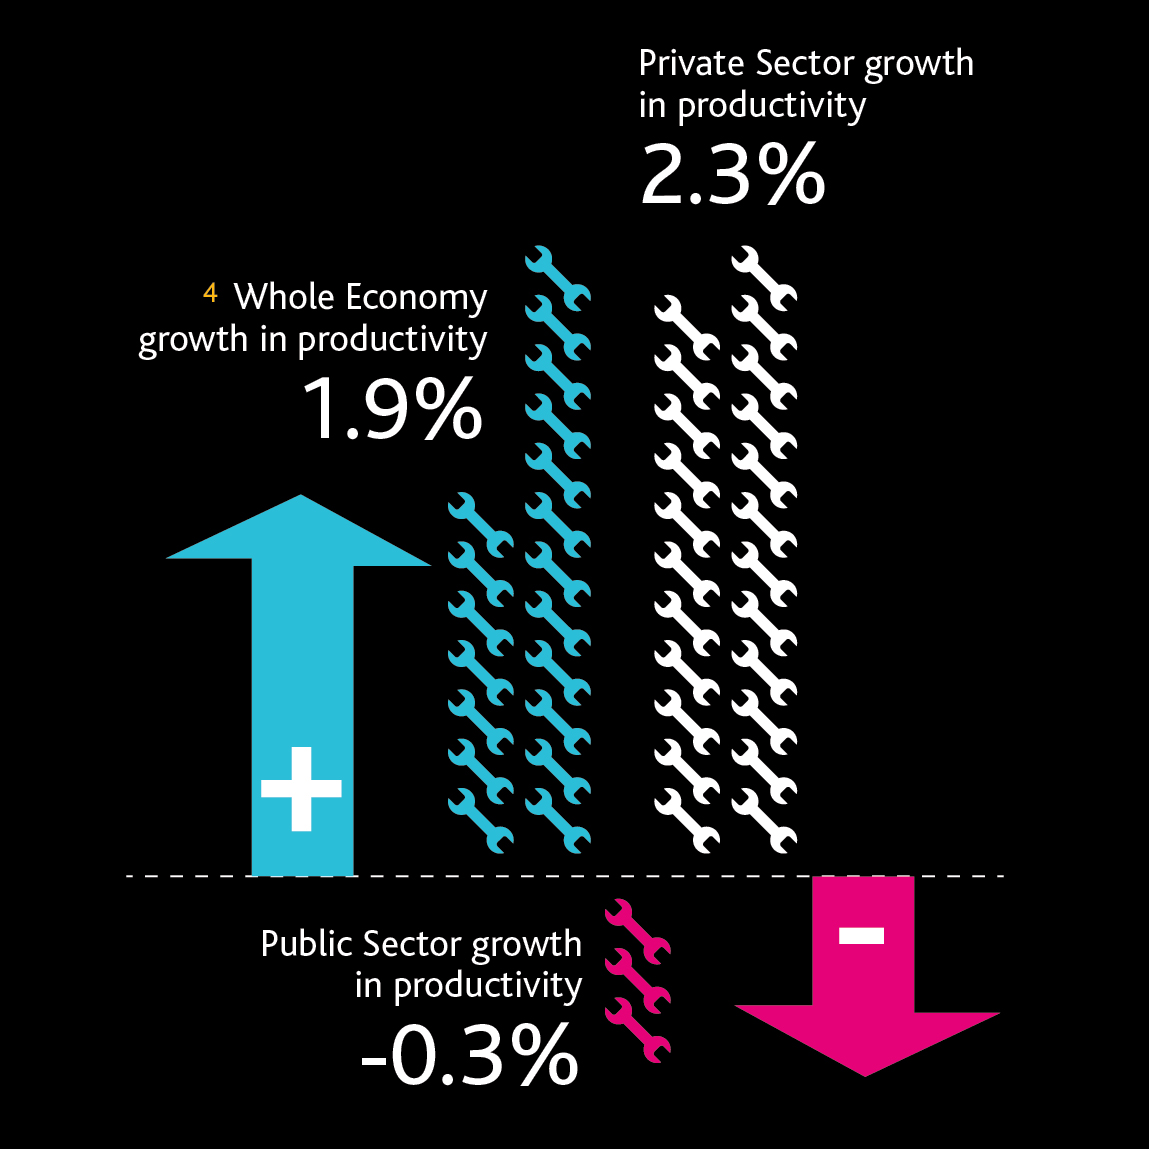
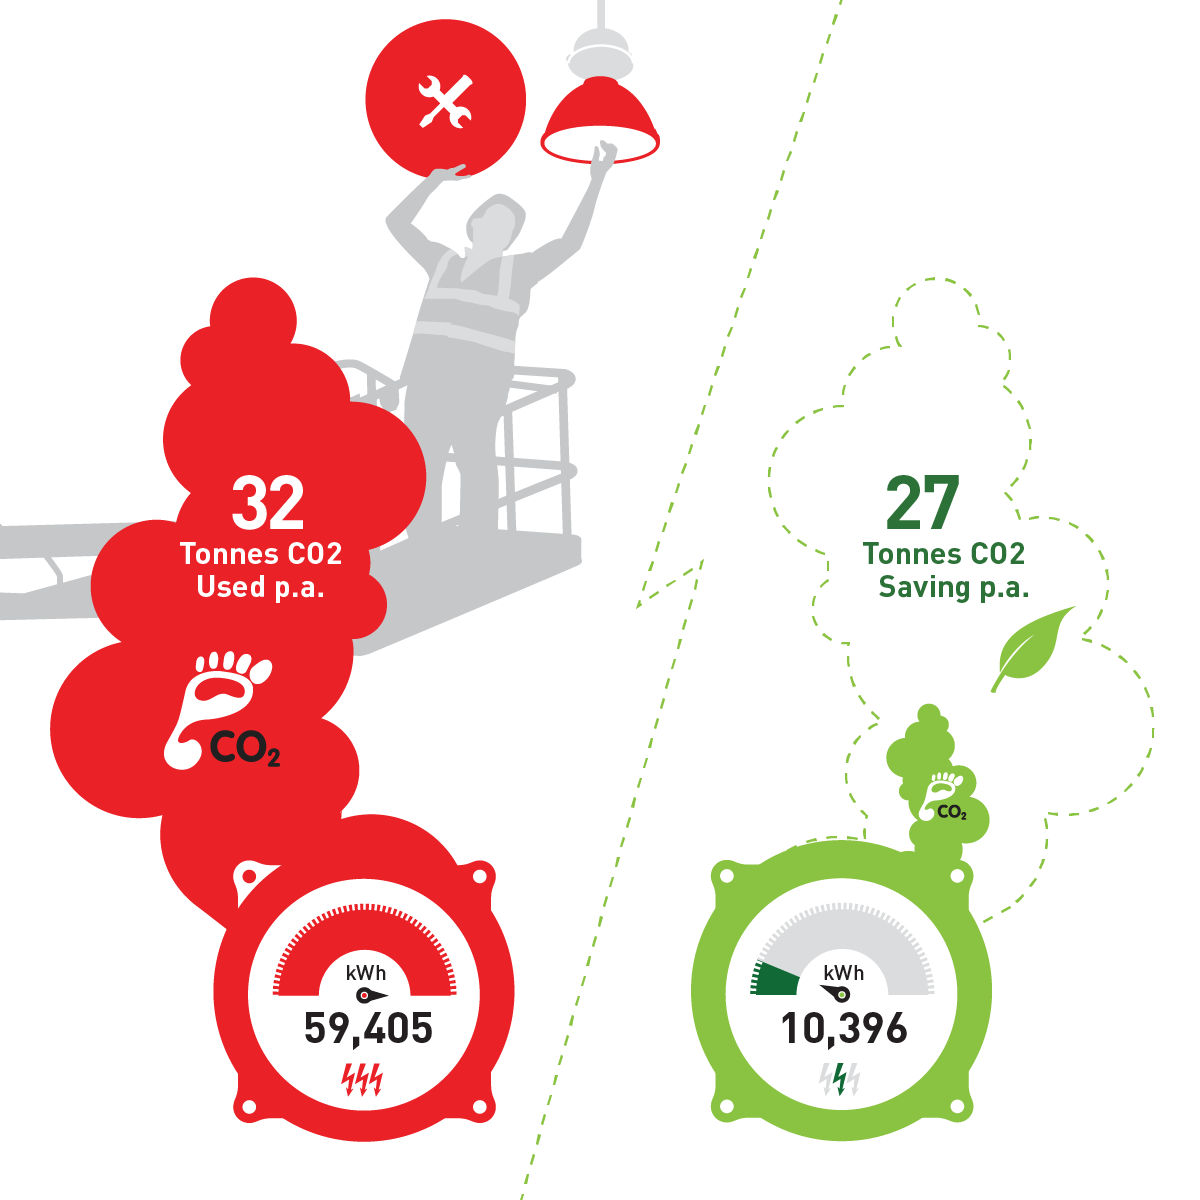
This infographic was created as part of a slide deck for Adara Associates Ltd, one of the companies we partner as their preferred designers. The client was Capita.

Let’s have a chat

Find out how we can help you visualise your data more effectively.
Book your free consultation now – Call 01189 109971 or use the contact form.

* Advertising Design   * Artwork   * Banner Ads   * Bespoke PowerPoint   * Branding   * Brochures   * Concepts   * Conference & Exhibitions   * Design for Print   * Email Marketing   * Flyers   * Icon Design   * Illustration   * Infographics   * Internal Comms   * Leaflets   * Logo Design   * Magazine Origination   * Packaging   * Point of Sale   * Photoshop Visuals   * Posters   * Presentations   * Promotional Material   * Retouching   * Slide Decks   * Social Graphics   * Vehicle Graphics   * Visualisation and Web Design… plus pretty much everything else!* Advertising Design   * Artwork   * Banner Ads   * Bespoke PowerPoint   * Branding   * Brochures   * Concepts   * Conference & Exhibitions   * Design for Print   * Email Marketing   * Flyers   * Icon Design   * Illustration   * Infographics   * Internal Comms   * Leaflets   * Logo Design   * Magazine Origination   * Packaging   * Point of Sale   * Photoshop Visuals   * Posters   * Presentations   * Promotional Material   * Retouching   * Slide Decks   * Social Graphics   * Vehicle Graphics   * Visualisation and Web Design… plus pretty much everything else!