These infographics were designed by Intrepid in conjunction with academics from University of Reading as part of a REF 2021 case study submission. These case studies are used to measure the impact of research in society. The more impact that can be demonstrated then the more funding the University receives and higher it ranks. A constraining factor that had to be considered when designing these graphics was the format of the final submission document. The submission documents are restricted to a rigid A4 template and a finite number of pages therefor the infographics had to remain legible at actual size.
Figure 1: Global reach of Halikiopoulou’s research on the far right
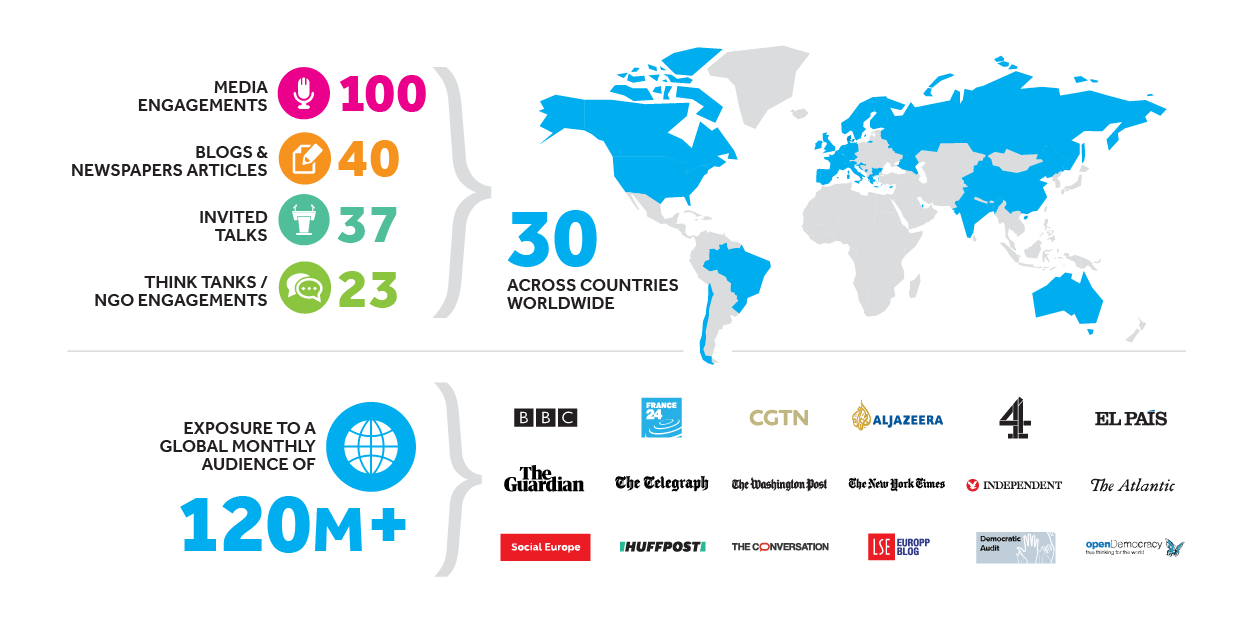
This figure shows the ‘journey’ of the research over time, geographically and the uptake by which organisation.
Figure 2: Tracking the uptake of the PopuList
![]()